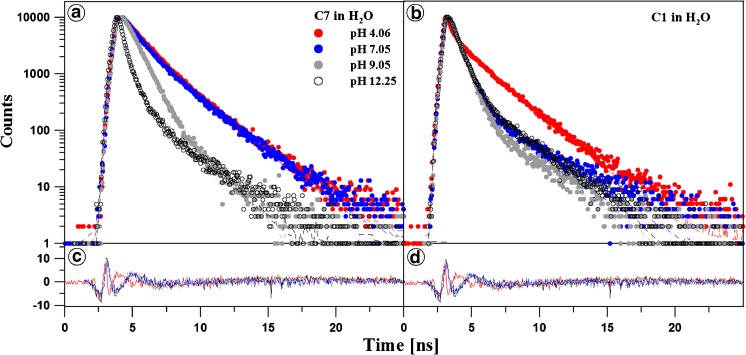
Fig. 3.
The pH effect of the fluorescence decay of C7 and C1 in water. Dotted curves show the decay of fluorescence emission observed using the TCSPC technique at a given pH for C7 and C1 in Panels A and B, respectively. Solid lines are best exponential fits. The excitation pulse profile, set up at 372, is shown by the dotted black curve. Residuals determined for the presented fits are shown below the decay curves in Panels C and D

