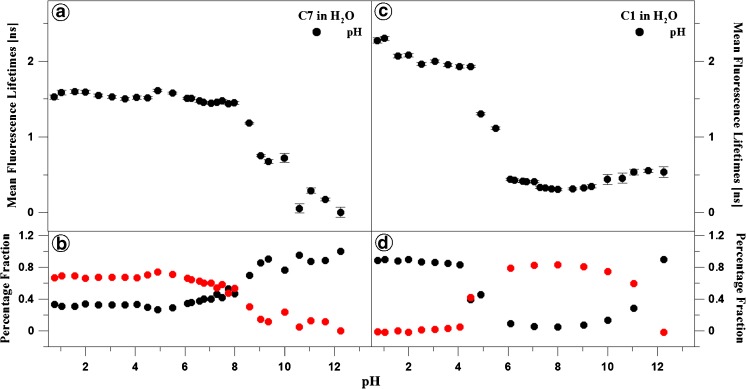
Fig. 4.
The effect of pH on the fluorescence lifetime for C7 (Panels A and B) and C1 (Panels C and D). The dependence of the mean fluorescence lifetimes on the best exponential fits at given pH are shown in Panels A and C, while intensities of the fractional fluorescence lifetimes are presented in Panels B and D

