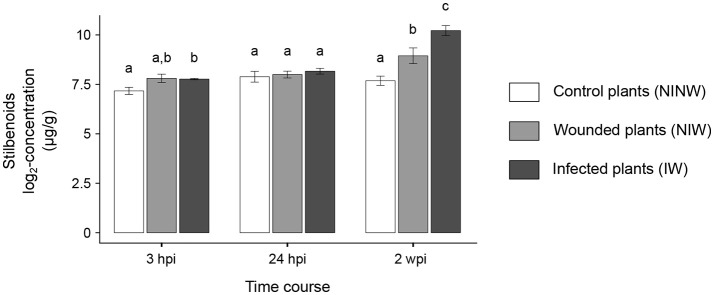
Figure 6.
Stilbenoid compounds concentrations in woody stems. Stilbenes data are expressed as mean ± standard deviation. ANOVA followed by Tukey's post-hoc test was used to compare the log2-transformed concentrations between the three treatment conditions (IW, NIW, NINW) at each time point. Adjusted P < 0.05 was considered statistically significant. At each time point, samples with the same letter are not significantly different.

