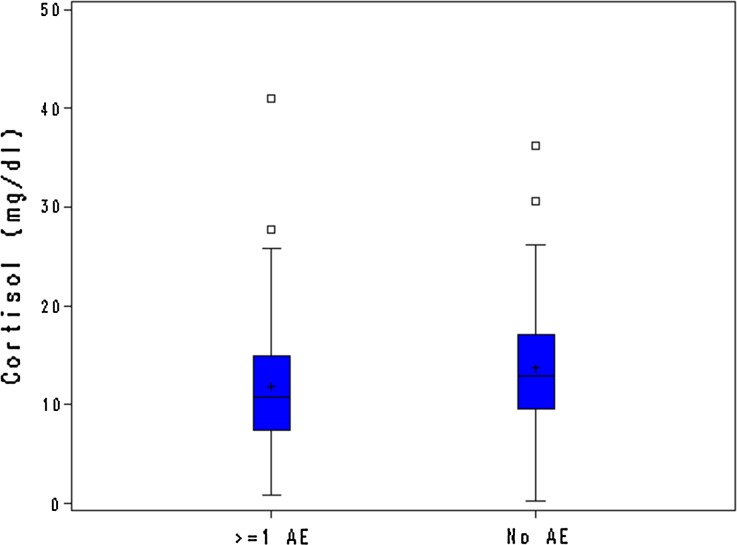
Fig. 3.
Cortisol levels in postmenopausal women with and without adverse events. The box plot of cortisol level (mg/dL) in postmenopausal women who experienced at least one adverse event (N = 66) and who did not experience any adverse events (N = 88) during the exposure period is shown. The upper and lower edges of the box represent the 75th and the 25th percentile, respectively. The line and the plus symbol inside the box correspond to the median and mean value, respectively. Whiskers are limited by the maximum observation below upper fence (upper limit) and the minimum observation (lower limit). Small squares above the upper edge of the whiskers represent observations beyond the upper fence, defined as 1.5 (interquartile range) above the 75th percentile

