
Figure 2.
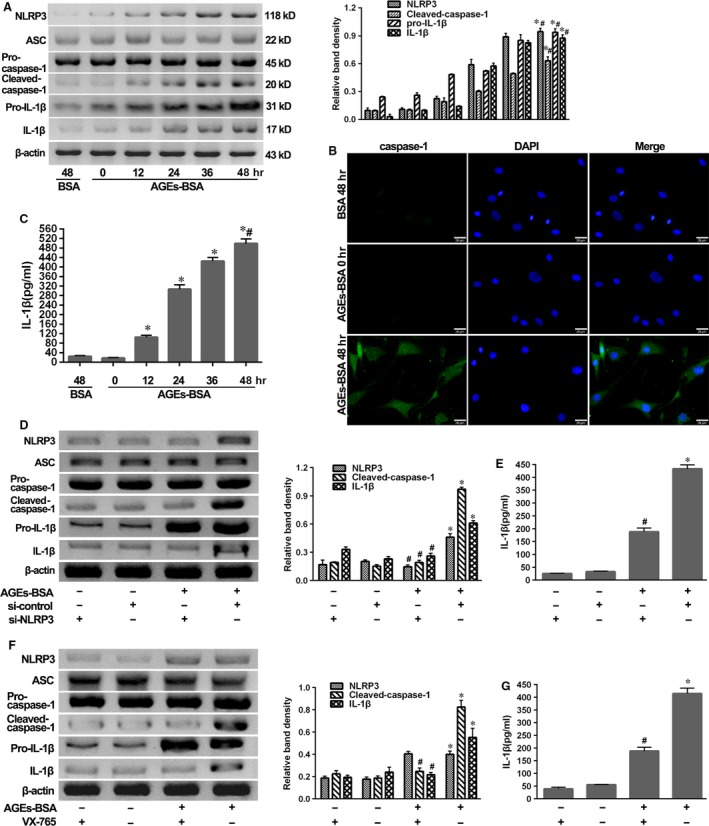
AGEs‐BSA induced the NLRP3‐inflammasome activation and secondary IL‐1β secretion. NP cells were isolated from IS patients. (A) Representative Western blot assay (left) and quantitation (right) of the expression profiles of NLRP3‐inflammasome components, pro‐IL‐1β and IL‐1β in NP cells after treatment with AGEs‐BSA (100 μg/ml) for 0–48 hrs or BSA (100 μg/ml) for 48 hrs. Data were presented as mean ± S.D. (n = 3). *P < 0.05 versus BSA (48 hrs). #P < 0.05 versus 0 hr. (B and C) Representative fluorescent images of caspase‐1 activity (B) and enzyme‐linked immunosorbent assay for the secretion profiles of IL‐1β (C) in NP cells or supernatant as described above. Data were presented as mean ± S.D. (n = 3). *P < 0.05 versus BSA (48 hrs). #P < 0.05 versus 0 hr. (D and F) Representative Western blot assay (left) and quantitation (right) of the expression profiles of NLRP3‐inflammasome components, pro‐IL‐1β and IL‐1β and (E and G) enzyme‐linked immunosorbent assay for the secretion profiles of IL‐1β in NP cells or supernatant induced by AGEs‐BSA for 48 hrs in the presence or absence of si‐NLRP3 transfection (D and E) or caspase‐1 inhibitor VX‐765 (F and G). Data were presented as mean ± S.D. (n = 3). *P < 0.05 versus si‐control, #P < 0.05 versus AGEs‐BSA + si‐control.