
Figure 5.
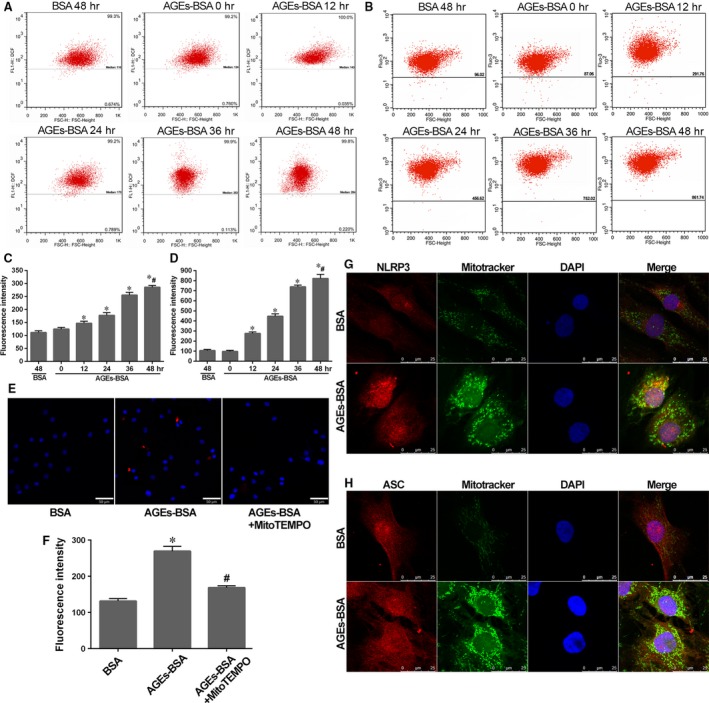
AGEs‐BSA promoted robust ROS generation and calcium mobilization in NP cells. The enhanced perinuclear localization of mitochondria and NLRP3/ASC indicated the association with NLRP3‐inflammasome activation. (A and B) Representative dot plot by flow cytometry analysis after labelling with fluorescent probe DCFH‐DA for ROS or Fluo‐3 AM for calcium in NP cells as described in Figure 2A. (C and D) Quantitative analysis of fluorescence intensity showed the corresponding ROS and calcium levels in NP cells. Data were presented as mean ± S.D. (n = 3). *P < 0.05 versus BSA (48 hrs); #P < 0.05 versus 0 hr. (E) Representative fluorescent images of mitochondrial ROS generation marked by MitoSOX (red), a mitochondrial ROS dye, in NP cells induced by AGEs‐BSA or pre‐treated with MitoTEMPO. Cell nuclei are stained by DAPI. (F) Quantitative analysis of fluorescence intensity of NP cells as described above. Data were presented as mean ± S.D. (n = 3), *P < 0.05 versus BSA; #P < 0.05 versus AGEs‐BSA. (G and H) NP cells showed an enhanced perinuclear localization of mitochondria and NLRP3/ASC in NP cells induced by AGEs‐BSA for 48 hrs. Red and green fluorescence indicated NLRP3/ASC and mitochondria signals, respectively. Cell nuclei are stained by DAPI.