
Figure 7.
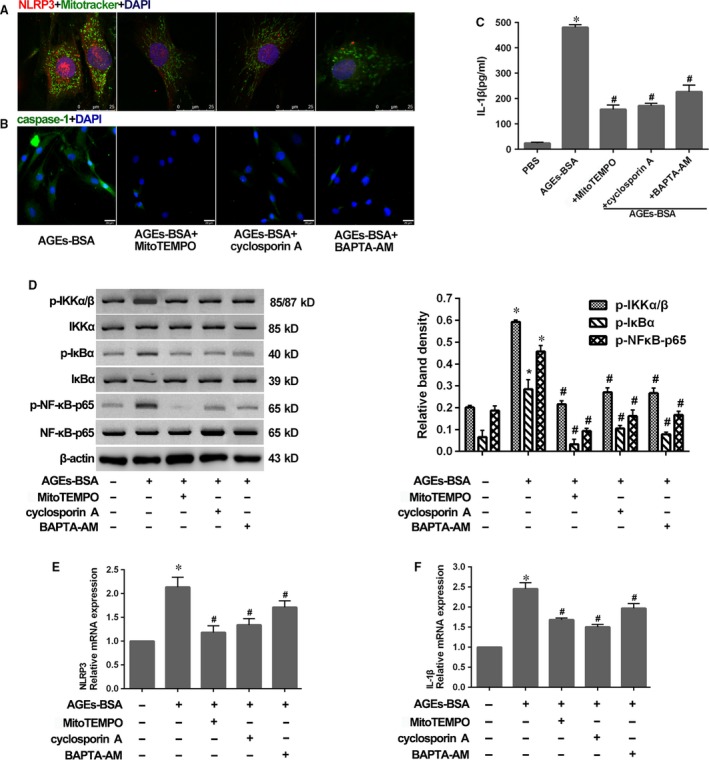
Rescued mitochondrial damage by MitoTEMPO, cyclosporin A or BAPTA‐AM attenuated NLRP3‐inflammasome activation. (A) Representative fluorescent images of co‐localization of NLRP3 and mitochondria in NP cells as described in Figure 6C. Red and green fluorescence indicated NLRP3 and mitochondria signals, respectively. Cell nuclei are stained by DAPI. (B and C) Representative fluorescent images of caspase‐1 activity (B) and enzyme‐linked immunosorbent assay for the secretion profiles of IL‐1β (C) in NP cells as described in Figure 6C. (D) Representative Western blot assay (left) and quantitation (right) showing phosphorylated (p‐) and total protein levels of IKKα/β, IκBα and NF‐κB‐p65, and (E and F) quantitative real‐time PCR for the transcript expression levels of NLRP3 and IL‐1β in NP cells as described in Figure 6C. Data were presented as mean ± S.D. (n = 3). *P < 0.05 versus control. #P < 0.05 versus AGEs‐BSA.