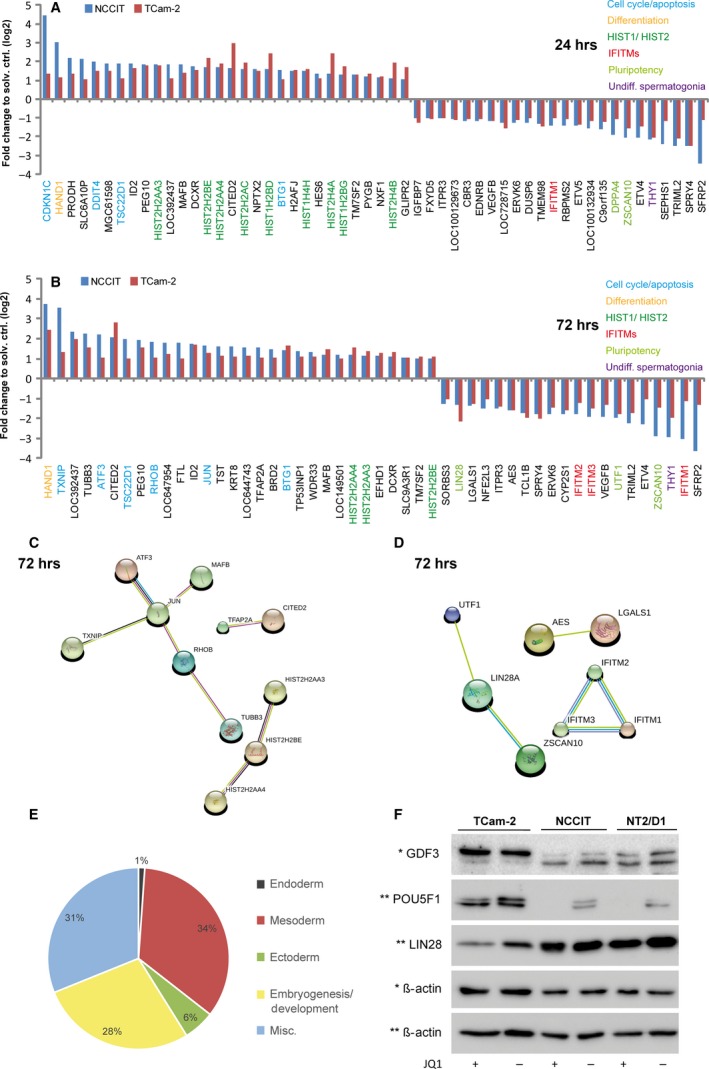
Figure 3.

(A, B) Microarray analysis of JQ1‐treated TCam‐2 and NCCIT cells after 24 (A) and 72 (B) hrs normalized to solvent controls. (C, D) STRING interaction networks of commonly up‐ (C) and down‐regulated (D) genes in TGCT cell lines after 72 hrs. (E) Pie chart summarizing the numbers of enriched biological processes among the up‐regulated genes in NCCIT cells after 72 hrs of JQ1 treatment. Data were sorted for the categories ‘endodermal’, ‘mesodermal’ and ‘ectodermal differentiation’, ‘embryogenesis/development’ and ‘miscellaneous’. (F) Western blot analysis showing protein levels of PRDM14, POU5F1 and LIN28 in JQ1‐treated TGCT cell lines.
