
Figure 4.
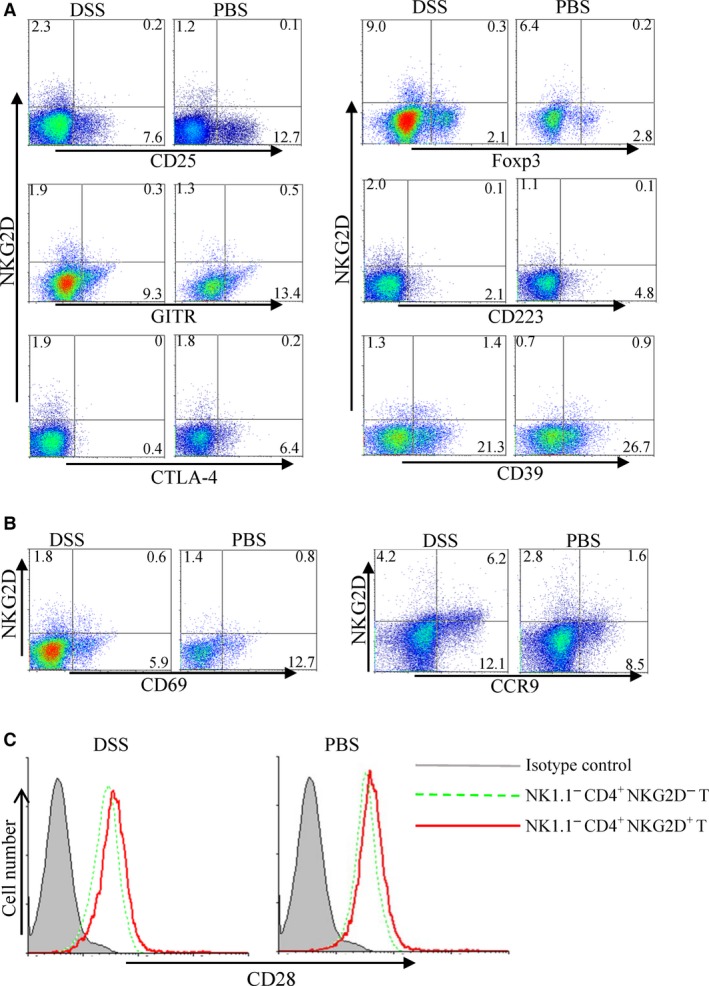
Comparison of phenotypic markers between splenic NK1.1− CD4+ NKG2D+ and CD4+ CD25+ Foxp3+ cells. CD25, Foxp3, GITR, CD223, CTLA‐4, CD39 (A), CD69 and CCR9 (B) expression of NK1.1− CD4+ NKG2D+ cells from DSS‐ or PBS‐treated mice. (C) CD28 expression on NK1.1− CD4+ NKG2D+ and NK1.1− CD4+ NKG2D− cells. The experiment was repeated at least six times.