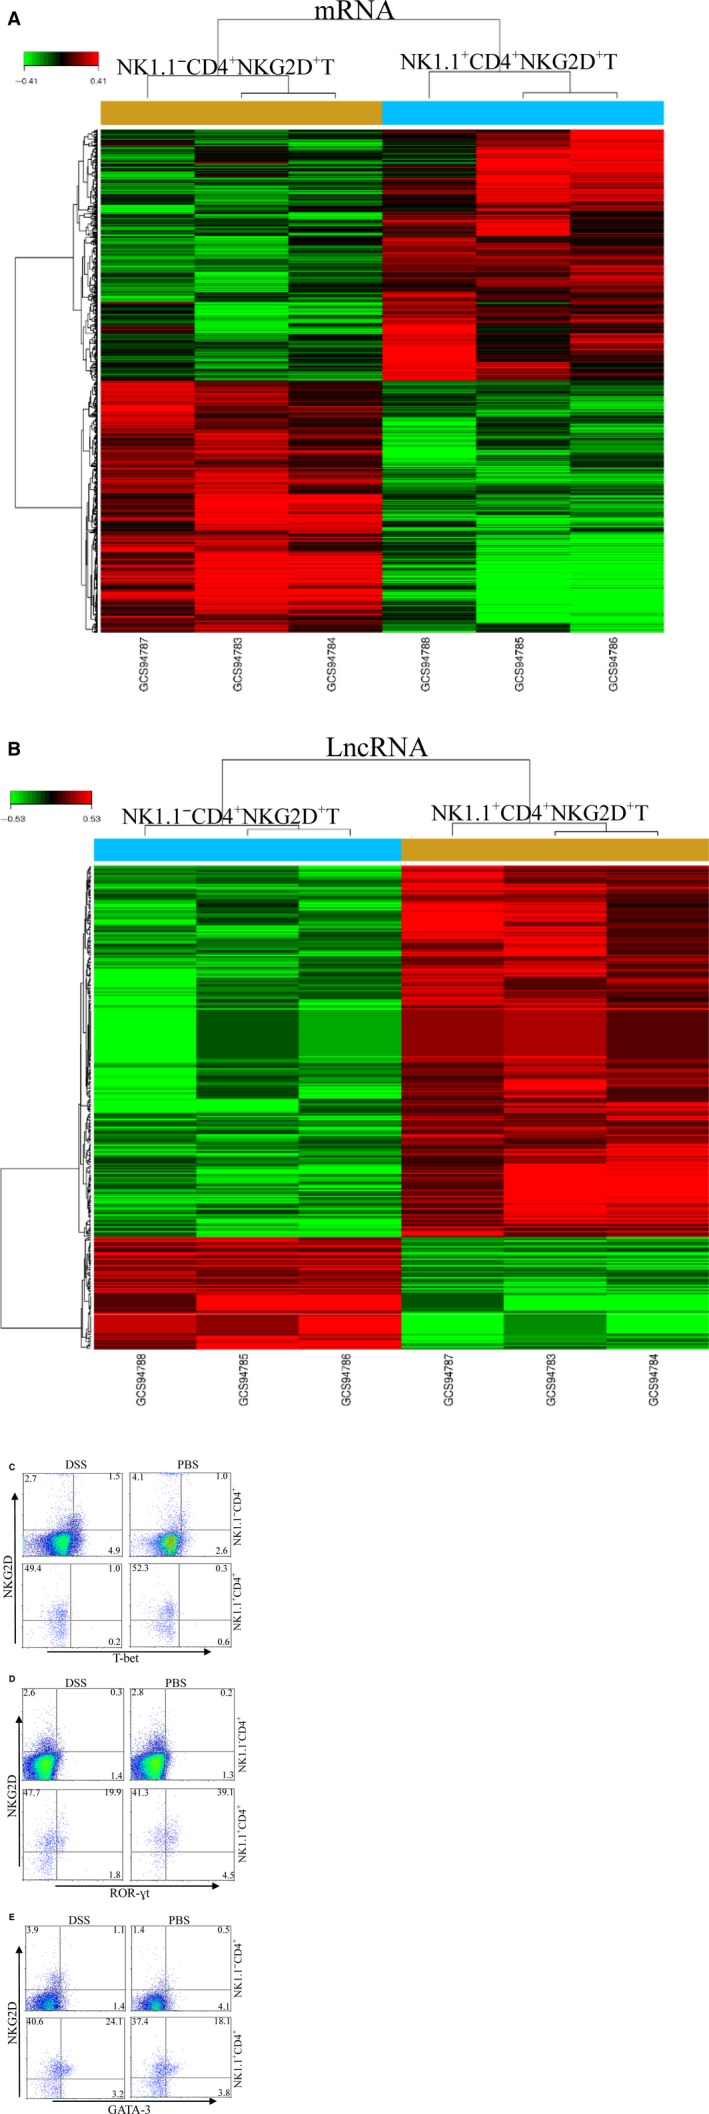
Figure 6.

Comparison of RNA transcription profiles between NK1.1− CD4+ NKG2D+ and NK1.1+ CD4+ NKG2D+ cells. Gene array analysis of mRNA (A) and lncRNA (B). Two subpopulations were isolated from spleens of normal mice. Intracellular T‐bet (C), ROR‐γt (D) and GATA‐3 (E) were detected using flow cytometry gated on NK1.1− CD4+ and NK1.1+ CD4+ cells. The experiment was repeated three times.
