
Figure 3.
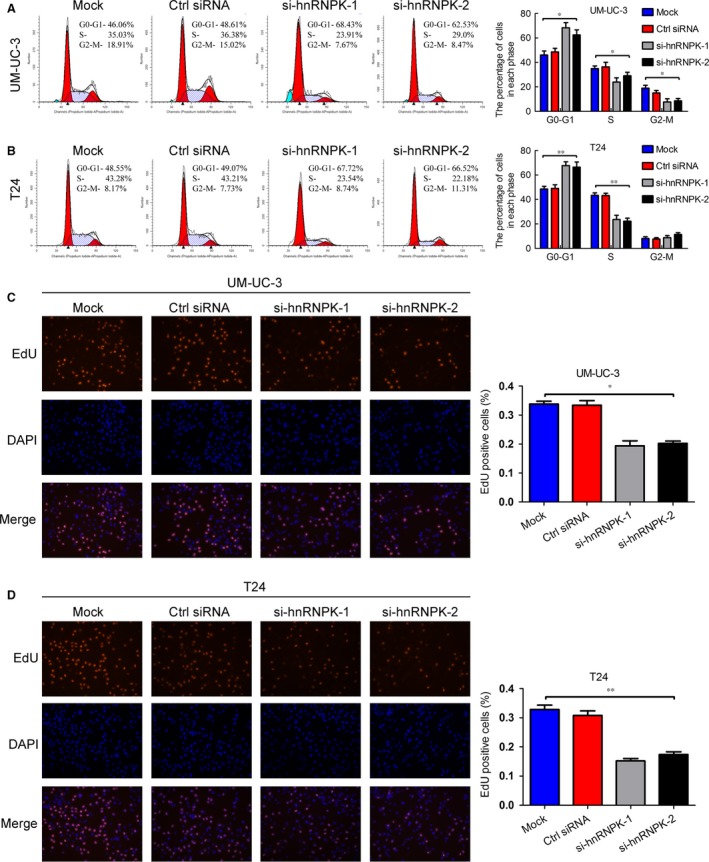
hnRNPK knockdown induces G0/G1 arrest in bladder cancer cells. (A and B) Flow cytometry analysis of UM‐UC‐3 and T24 cells transfected with si‐hnRNPK or control siRNA for 48 hrs. The percentages (%) of cell populations at different stages of the cell cycle are listed in the panels. All histograms show the percentage (%) of cell populations from three independent experiments. (C and D) EdU assay measurement of the cell population in the S phase. Blue, nucleus; red, S‐phase cells (EdU‐positive). Histological analysis of the percentage of EdU‐positive cells in control and hnRNPK knockdown cells is shown. The results are presented as the means ± S.D. of three independent experiments. *P < 0.05, **P < 0.01.