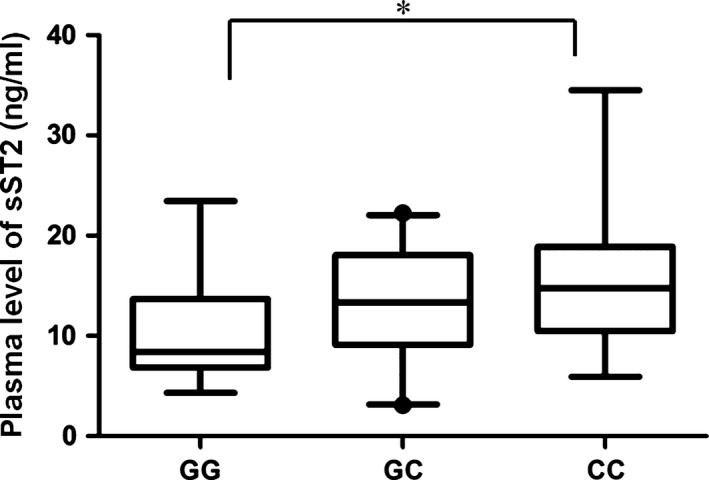
Figure 2.

Circulating sST2 levels differ by rs3821204 genotype. Plasma concentrations of sST2 protein were measured by ELISA in 50 healthy donors carrying different rs3821204 genotypes (GG, n = 14; GC, n = 25; and CC, n = 11). Box plots indicate minimum, 10% percentile, maximum and 90% percentile for each group. *P < 0.05.
