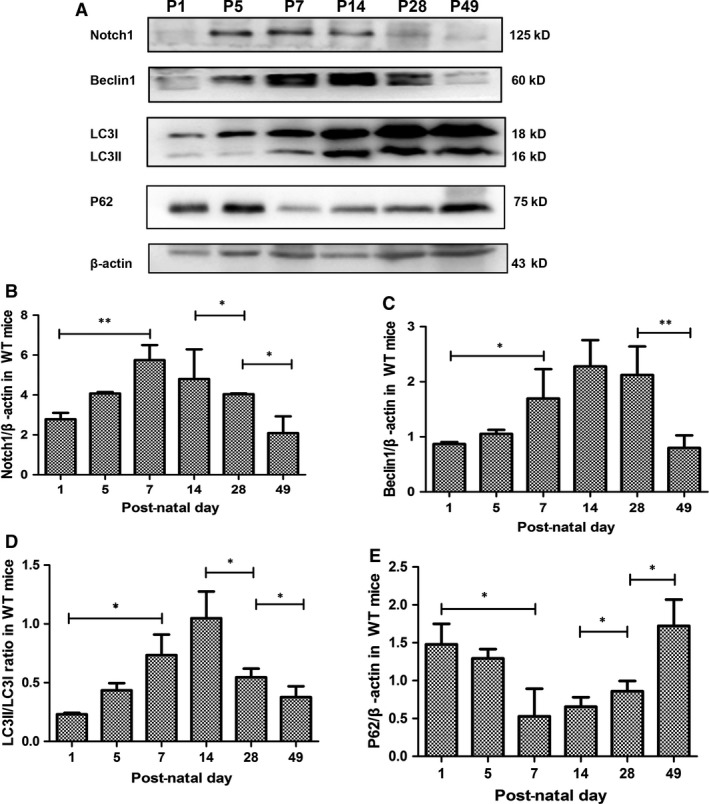
Figure 2.

The dynamic changes of Notch1 coincided with the autophagy during renal development. (A) Immunoblot analysis of Notch1 and autophagy in renal cortex in post‐natal day 1 (P1), P5, P7, P14, P28 and P49. (B) Quantitative immunoblot analysis of the full‐length Notch1. (C–E) Summarized data from densitometric analysis of the Beclin‐1, LC3 and P62 signals from immunoblots, respectively. Data were presented as means ± S.D. of ≥3 independent experiments. *P < 0.05, **P < 0.01
