Figure 6.

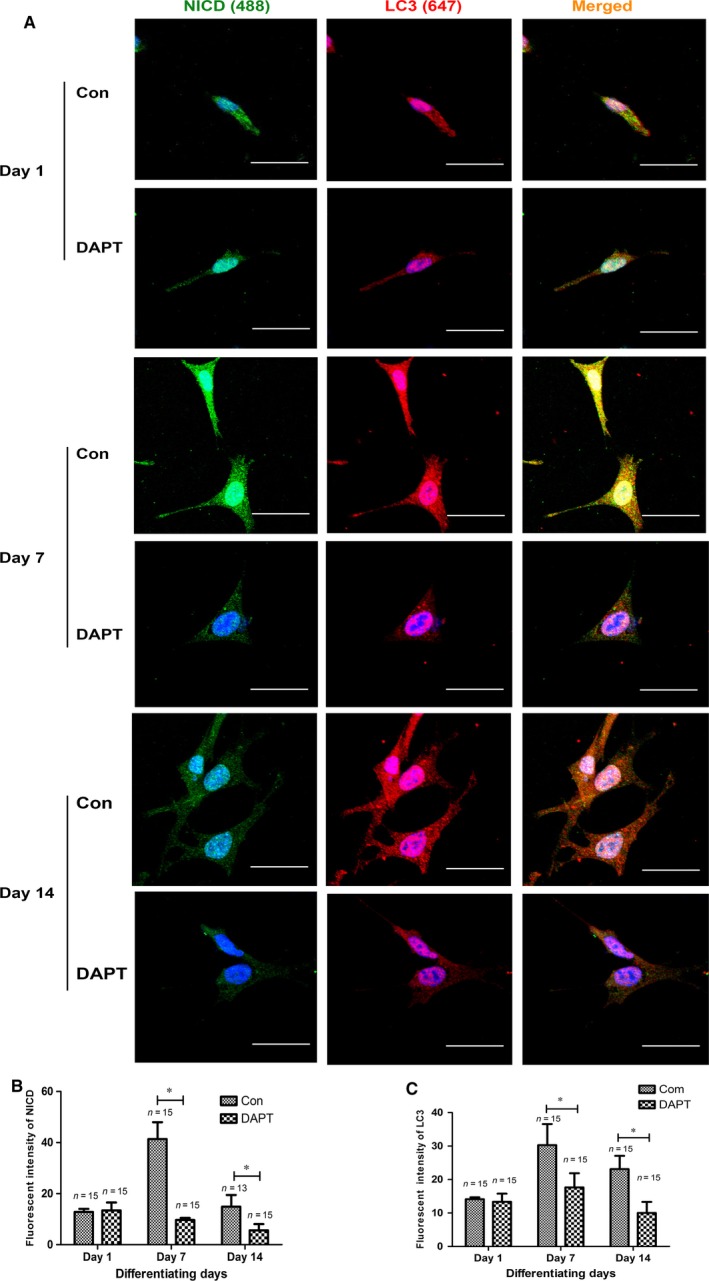
The colocalization of NICD and autophagy in control and DAPT‐treated podocytes during the differentiation process. (A) NICD (Alexa 488, green) and LC3 (Alexa 647, red) were evaluated in undifferentiated (Day 1), differentiating (Day 7) and differentiated cells (Day 14). Scale bar: 40 μm. (B–C) Fluorescent intensity of NICD and LC3 in podocytes at different differentiation stages. Data were presented as the means ± S.D. of ≥3 independent experiments. *P < 0.05.
