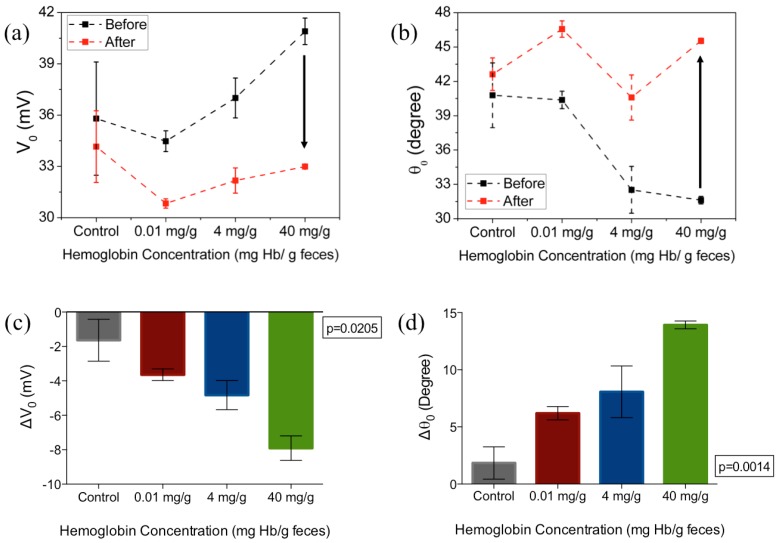
Figure 5.
The (a) amplitude and (b) phase of the output voltage measured before and after 1 h incubation in hemoglobin-spiked fecal samples of different sample concentrations; (c,d) show the changes in amplitude and phase from baseline, respectively. Figures represent mean with standard error of the measurement. The excitation frequency is 1 kHz, n= 3 per concentration tested.

