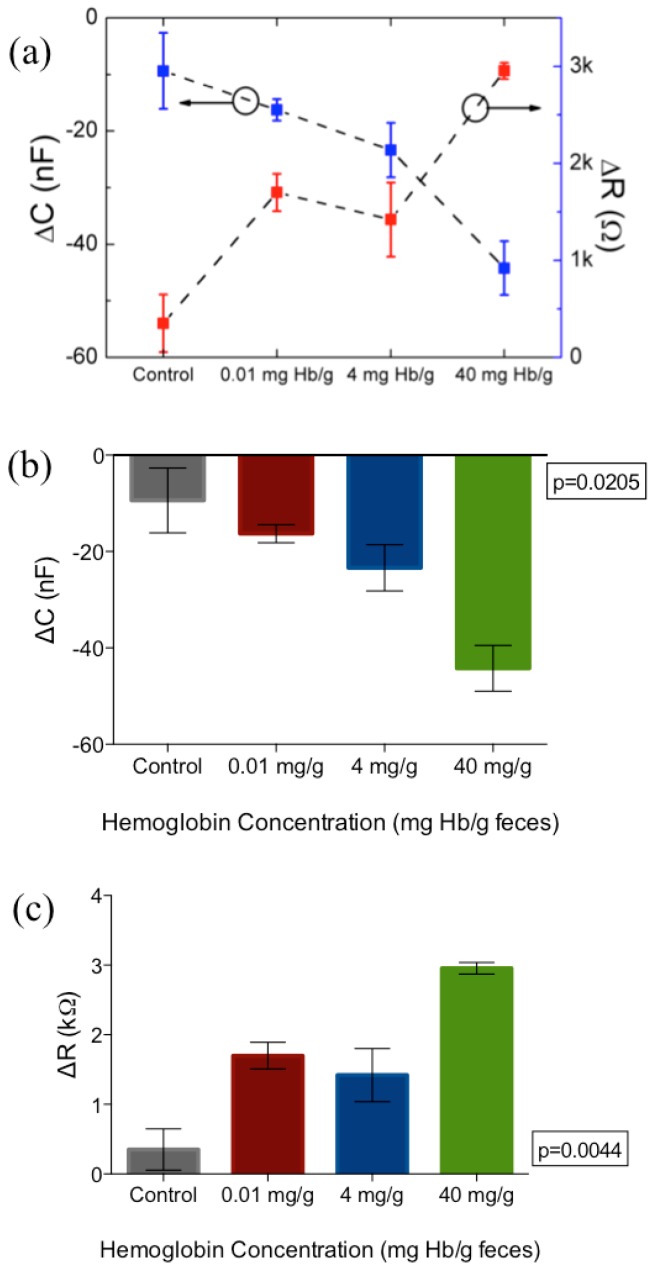
Figure 7.
(a) Monotonic increase in resistance (red) and capacitance (blue) at 1 kHz with increasing concentration of fecal hemoglobin. (b,c) show changes from baseline for both capacitance and resistance respectively at 1 kHz applied frequency. Figure represents mean and standard error of measurement. N = 3 per concentration tested.

