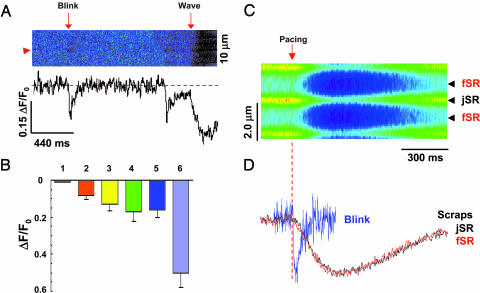
Fig. 3.
Blinks revealing mechanisms of spark termination. (A) Same-site comparison of jSR depletions in blinks vs. Ca2+ waves. The fractional blink/wave amplitude is 0.61 at the site marked by arrowhead. (B) Statistical analysis of fluo-5N signal (ΔF/F0) for averaged blink from spark–blink pairs (bar 1), individually resolved blinks (bar 2), individual blinks corrected for background contamination (bar 3), full-fledged excitation-evoked release (bar 4), Ca2+ waves (bar 5), and caffeine (10 mM)-elicited Ca2+ release (bar 6). Data are expressed as mean ± SD and n = 6–86. (C) Action potential-elicited store Ca2+ transients or scraps. ΔF/F0 = -0.17 ± 0.05, n = 6. Such [Ca2+] transients correspond to a 65% reduction in the free [Ca2+] and a 38% diminution of the calsequestrin-bound Ca2+ (see Methods). Arrow and dashed line mark the timing of electrical stimulation. (D) Comparison between jSR scraps and blinks. Traces are normalized to the same amplitude. The traces for scraps at jSR and fSR essentially overlap, and the tnadir was 137 ± 44 ms, and the half-recovery time was 194 ± 92 ms (n = 6).

