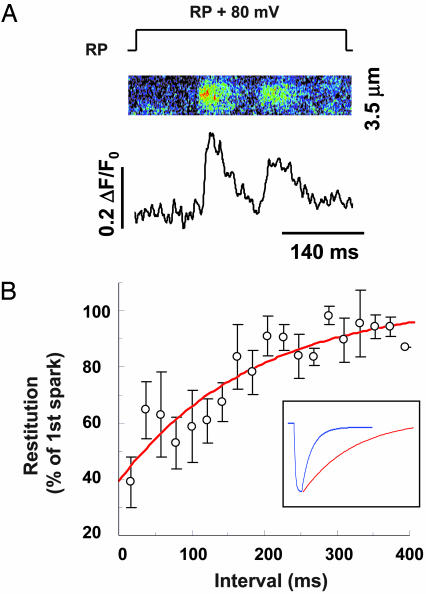
Fig. 4.
Time courses of refilling of local Ca2+ store and refractoriness of local Ca2+ release. (A) Typical results of a pair of Ca2+ sparks evoked beneath the patch membrane in response to a 80-mV patch depolarization from the resting potential (RP, approximately -75 mV). Note the reduced amplitude of the succeeding spark. (B) The restitution curve for spark amplitude; 167 pairs of sparks obtained by using the protocol in A were grouped by intervals at 20-ms increments. n = 5–12 at each data point. (Inset) Comparison between the fitted blink time course (blue curve, from Fig. 2D) and the fitted restitution curve (red curve, τ = 187 ms).

