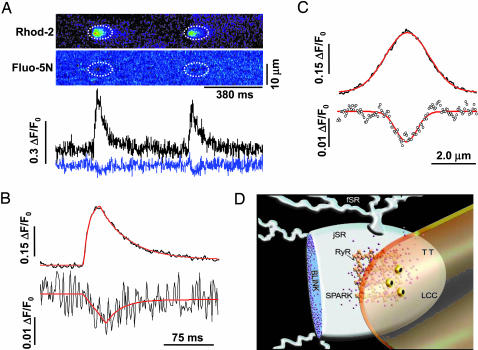
Fig. 5.
Visualization of complementary spark–blink signal pairs. (A) Simultaneous measurements of sparks and blinks. (Upper) Linescan images of repeated sparks (rhod-2, upper) and blinks (fluo-5N, lower). Dotted ellipses mark corresponding areas in the images. (Lower) Time courses of sparks (black, upper) and blinks (blue, lower). (B) Time courses of the spark (upper) and blink (lower) averaged from 86 event pairs in 9 cells. The fitted smooth curves (red) show sparks (upper) displaying ΔF/F0 = 0.30, tpeak = 21 ms, and τrecovery = 43 ms, and blinks (lower) displaying ΔF/F0 = 0.013, tnadir = 32 ms, and τrecovery = 23 ms. Averaged spark obtained with rhod-2 alone (n = 22 events) displayed ΔF/F0 = 0.41, tpeak = 19 ms, and τrecovery = 31 ms, suggesting that fluo-5N retention in the SR does not alter spark properties. (C) Averaged spatial profiles. Upper: Ca2+ spark (FWHM = 2.2 μm); lower: Ca2+ blink (FWHM = 1.0 μm). (D) Overview of the Ca2+ spark–blink duality with respect to transverse tubule (TT) and SR. LCC, L-type Ca2+ channel..

