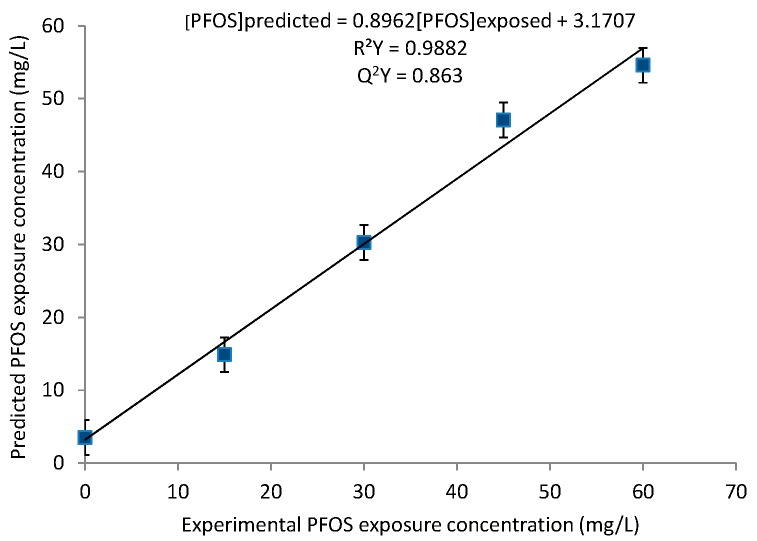
Figure 2.
Partial Least Squares (PLS) regression model derived from the leave-one-out cross-validation procedure, illustrating the average predictions of PFOS exposure concentrations using the bucketed 1H NMR spectra. The relationship between the predicted and experimental data is linearly correlated with a R2Y of 0.9882 and a Q2Y of 0.863.

