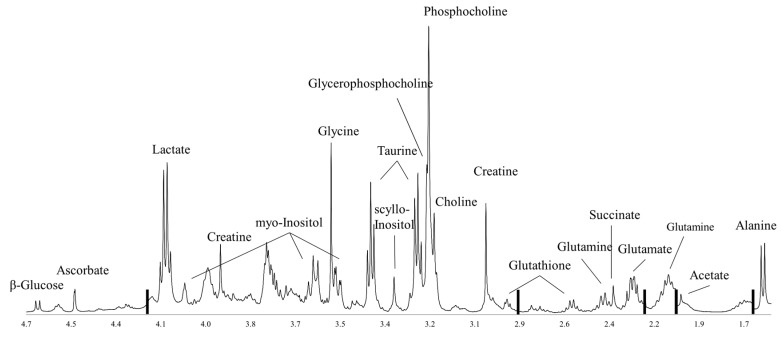
Figure 2.
A representative proton HR MAS MR breast tumor tissue spectrum acquired using a Carr-Purcell-Meiboom-Gill (CPMG) pulse sequence on a 600 MHz spectrometer. Black bars represent excluded lipid regions. The spectral region shown excludes the water signal and above (>4.7 ppm) and regions with characteristically high and broad lipid signals (<1.4 ppm).

