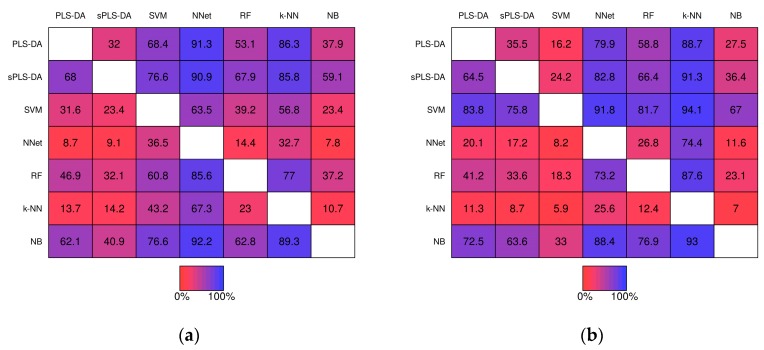
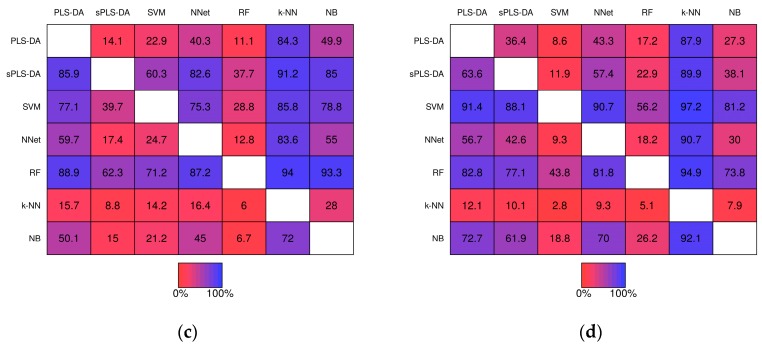
Figure 6.
Matrices showing the proportion of the time a fixed technique performed better than another fixed technique during the same simulation study. Proportions were computed from the 1000 baseline simulation studies prior-to significance filtering (a) and post-significance filtering (b); and from the 1000 realistic simulation studies prior-to significance filtering (c) and post-significance filtering (d).


