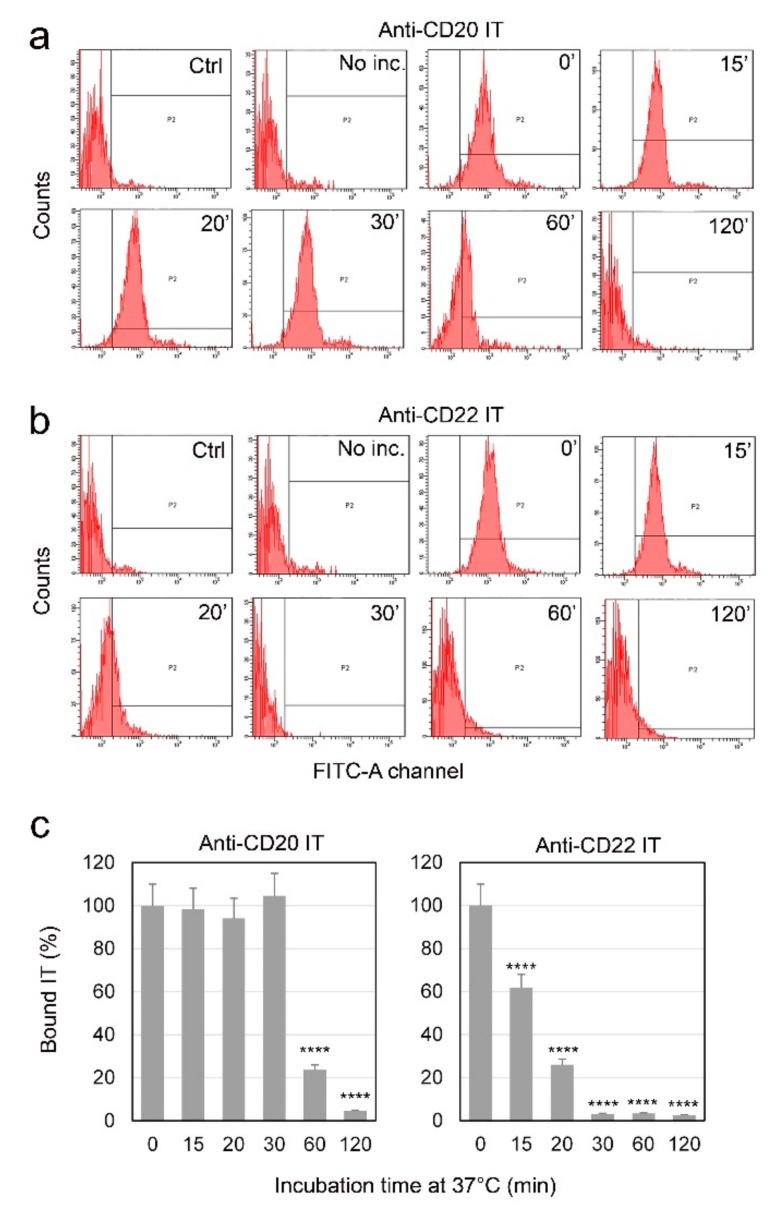
Figure 4.
Evaluation of the internalization time of the antigen-immunotoxin complex by cytofluorimetric analysis in Raji cells. Samples were prepared by incubating cells with 10 nM anti-CD20 IT (a) or anti-CD22 IT (b) for 30 min on ice to allow the binding of the IT to the antigen, avoiding the internalization of the complex. After cell incubation for 0–120 min at 37 °C, the corresponding FITC-secondary antibody was added. Negative controls were carried out by incubating cells with complete medium alone (ctrl). A second series of controls were obtained without the 30 min pre-incubation at 0 °C and instead putting cells into contact with the IT for only an instant (No inc.). In Figure 4c, the percentage of cell membrane bound IT at the indicated times is reported. The bound IT is expressed as the percentage of mean fluorescence intensity values for each time point with respect to those of the 0 min samples, which was considered the maximum antigen binding. The values significantly lower than the 0 min samples are indicated by asterisks (**** p < 0.0001). The results are the means of three independent experiments.

