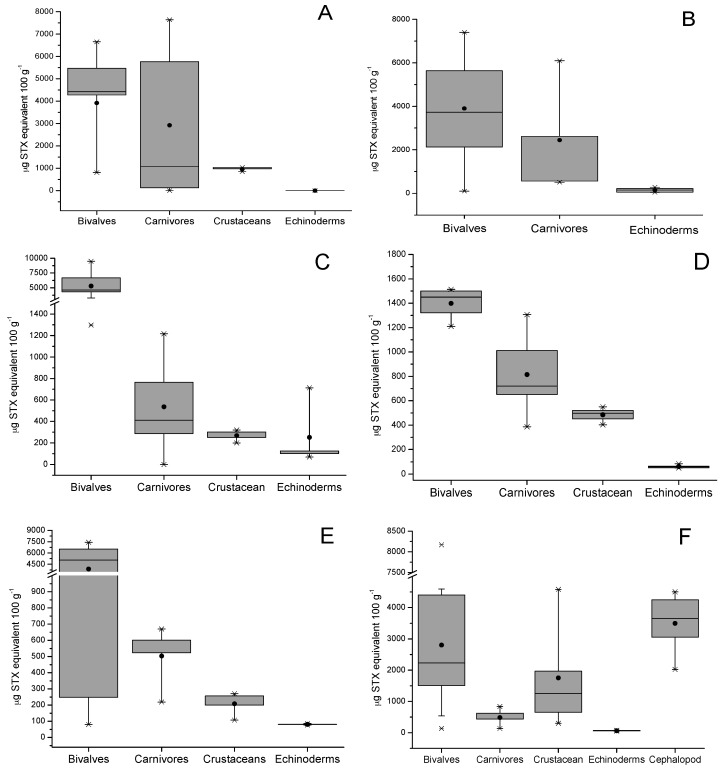
Figure 3.
The saxitoxin-group (STX-group) toxin contamination in different shellfish species. (A–F) represent the different extraction areas of marine vertebrates (see Section 4). The bottom and top of the box are the first and third quartiles; the band inside the box is the second quartile (the median); the ends of the whiskers represent one standard deviation above and below the mean of the data, and the dots are mild outliers.

