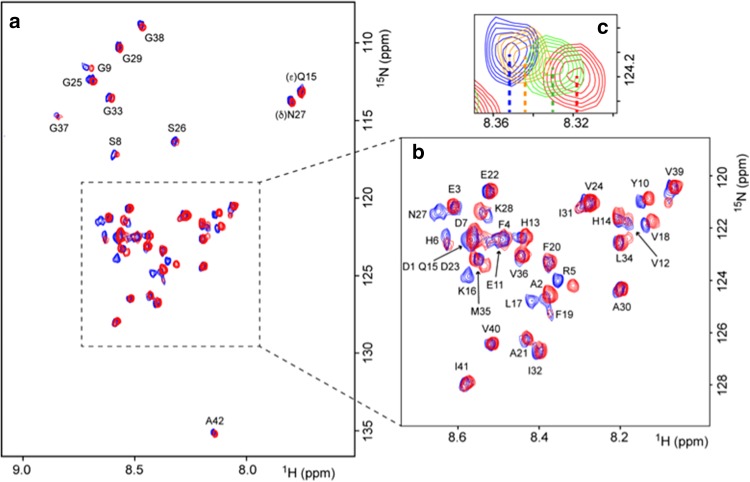
Fig. 6.
2D 1H-15N heteronuclear multiple quantum correlation (HMQC) nuclear magnetic resonance (NMR) spectrum showing interactions of tramiprosate with amyloid beta Aβ42. a 2D 1H-15N HMQC NMR spectrum with assignments. Aβ42 alone is shown in blue, and Aβ42 with tramiprosate at a ratio of 1:1000 is overlaid in red. b An expanded view of part of a. Assignments in red indicate a significant observed chemical shift perturbation. c Example of a chemical shift perturbation of R5 residue observed when Aβ42 was incubated with tramiprosate at a ratio of 1:1000. Residue R5 is an isolated peak that clearly shows a chemical shift as the tramiprosate concentration is increased. The dotted lines illustrate the center of each peak to gauge the change in chemical shift at each concentration level. The color coding represents no tramiprosate (blue), 100:1 (gold), 500:1 (green) and 1000:1 (red) tramiprosate to Aβ42

