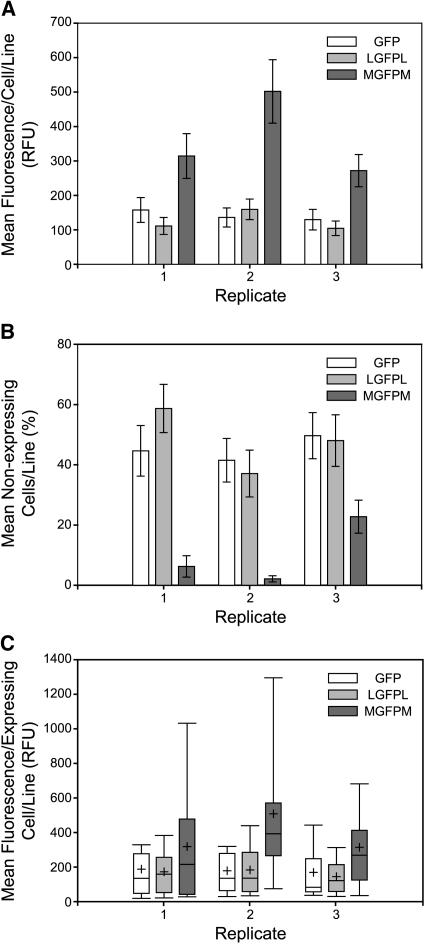
Figure 4.
Summary of GFP Expression in Individual Transgenic Cell Lines for Three Replicate Experiments.
Tobacco protoplasts were analyzed by flow cytometry, and results from ∼30 cell lines each of GFP, LGFPL, and MGFPM T-DNA vector transformations are shown for each replicate.
(A) Mean GFP fluorescence per cell in cell lines transformed by each of the vectors (data from both GFP positive cells and GFP negative cells are included). Error bars denote se.
(B) Mean percentage of GFP negative cells in cell lines transformed by each of the vectors. Error bars denote se.
(C) Box plots of GFP fluorescence per GFP positive cell in cell lines transformed by each of the vectors (data from GFP negative cells is not included). The boundaries of the boxes indicate the 25th and 75th percentiles. The whiskers above and below the box indicate the 10th and the 90th percentiles. The median and the mean are represented by a solid line within the box and a plus sign, respectively.

