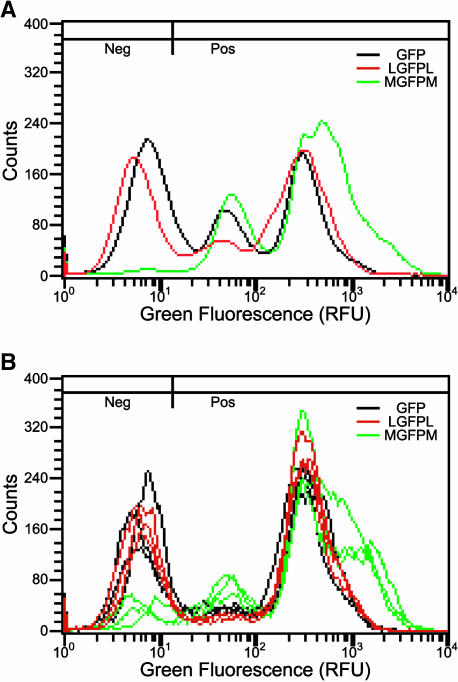
Figure 6.
Comparison of GFP Expression in Averaged Individual Cell Lines and Population Cell Cultures.
(A) Average green fluorescence histograms of all 30 individual cell lines for each treatment from the second replicate experiment (10 of which are shown in Figure 3).
(B) Green fluorescence histograms from population cultures established from the same A. tumefaciens cocultivation transformation plates used to isolate individual lines summarized in (A). Three independent cultures were established for each T-DNA vector. Parameters for histograms are the same as in Figure 2B.

