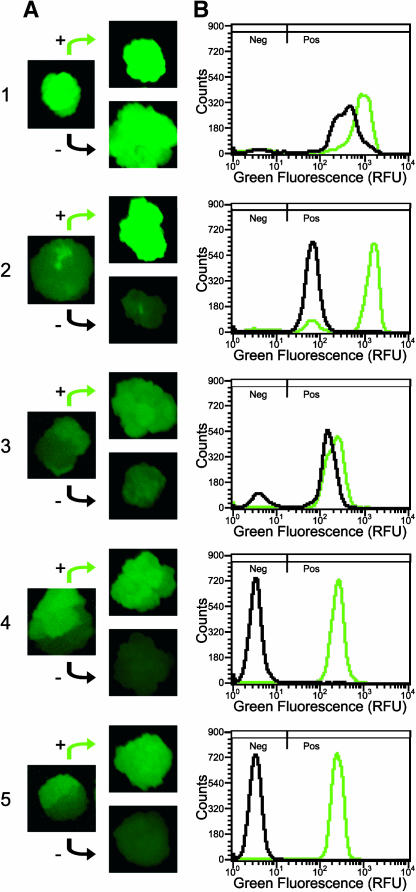
Figure 7.
Isolation of Callus Sectors Expressing GFP at Different Levels and Flow Cytometric Analysis.
(A) A subset of calli display sectored GFP phenotype (left column). Tissue from these sectors was subcultured on fresh solid medium (right column). The plus sign denotes tissue from the sector with the higher level of green fluorescence, whereas the minus sign denotes tissue from the sector with the lower level of green fluorescence. Sectored calli from each T-DNA vector were chosen for further analysis: sample 1 from GFP T-DNA; sample 2 from MGFPM T-DNA; samples 3, 4, and 5 from LGFPL T-DNA.
(B) GFP fluorescence histograms of liquid cultures initiated from sectors in the right column of (A). The black histogram is from the (−) sector, and the green histogram is from the (+) sector. Parameters for histograms are the same as in Figure 2B.

