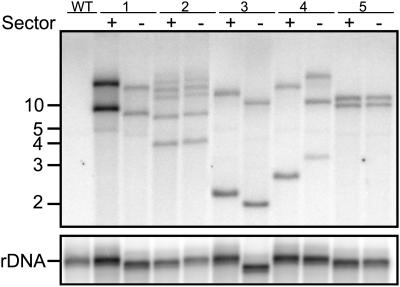
Figure 8.
Genotyping Sectors by DNA Gel Blot Analysis.
DNA was isolated from liquid cultures initiated from callus sectors (Figure 6A, right column). Blots of 15 μg of DNA digested with the methylation-insensitive restriction enzyme HindIII (which cuts only once within the T-DNA) and separated by electrophoresis were probed with a portion of the right T-DNA border common to all vectors. Each banding pattern represents a transgenic fingerprint for each sector. The blot was reprobed with rDNA to account for differences in DNA loading and differences in DNA mobility attributed to possible differences in salt concentrations. Numbers to the left are approximate DNA size markers in kilobases.

