Figure 3.

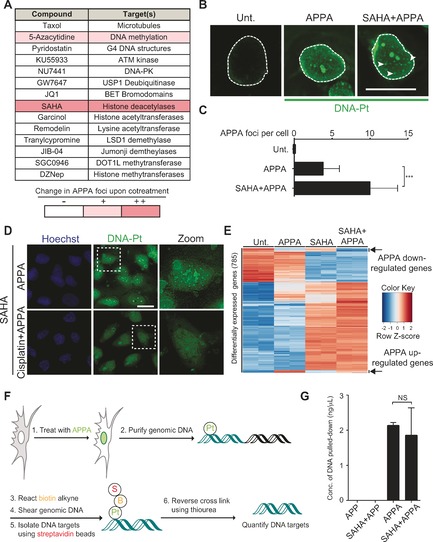
A) Small molecules screened for effects on genome targeting with APPA. B) Fluorescence microscopy detection of labeled DNA‐Pt. Arrows indicate DNA‐Pt foci. Scale bars, 20 μm. C) Quantification of B. >100 cells scored per condition; n=3; Foci were counted by means of visual inspection. D) Cisplatin competes with APPA for genome targeting. Zoomed images are 3×. Scale bars, 20 μm. E) Heatmap of differentially expressed genes in SAHA and APPA cotreated cells. Genes were selected based on differential expression in SAHA and APPA cotreatment compared to untreated. Data from two independent experiments per condition are shown. Gene expression was monitored by RNA‐Seq as described in Supporting Information. F) Scheme of DNA‐Pt pull‐down methodology. G) Quantification of DNA isolated by pull‐down from samples treated as indicated; n=3. All experiments performed in U2OS cells. Cells were treated with APPA (250 μm for 3 h), APP (250 μm for 3 h), SAHA (2.5 μm for 5 h) and cisplatin (500 μm for 5 h). Error bars represent mean ±SD; ***P<0.001, Student's t‐test; NS, not significant.
