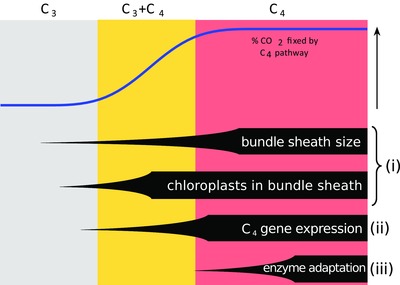
Figure 1.

Schematic of expected changes during the transition from C3 to C4.
The continuous variation in anatomical and biochemical components can be simplified using three phenotypic categories; C3 plants, C3+C4 intermediates, and C4 plants. A schematic indicates the proportion of atmospheric CO2 fixed by the C4 cycle, and the expected order of modifications is shown at the bottom for four categories of changes, with the number on the right indicating the section of our analyses where they are investigated.
