
Figure 2.
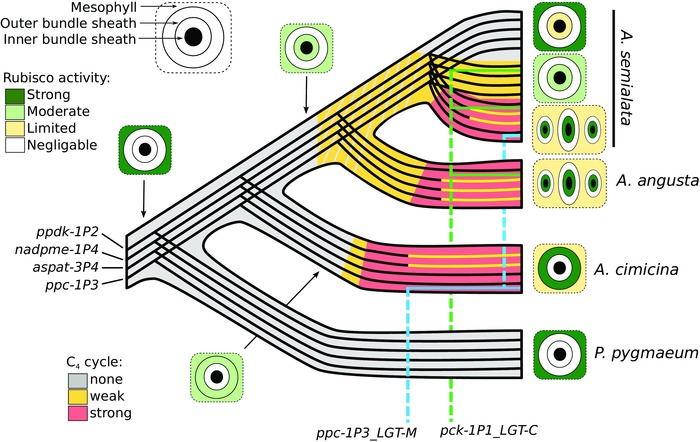
Inferred transitions among C4 components.
A schematic phylogenetic tree is presented, based on previous genome‐wide analyses (Lundgren et al. 2015; Olofsson et al. 2016). Individual lines represent the transmission of individual genes within the species complex. For each of the four genes subject to C4‐related selection, episodes of positive selection are indicated by changes to yellow. Other lines track the spread of two genes that were originally laterally‐acquired from distant relatives, and have subsequently been introgressed among Alloteropsis species. The inferred phenotype is represented by the background colour, in grey for C3, in yellow for C3+C4, and in red for C4. The grey hatching indicates uncertainty about the ancestral state. A simplified version of leaf anatomy is represented, for extant taxa and some hypothetical ancestors (see Fig. S1 for details of leaf anatomy of extant accessions).