
Figure 4.
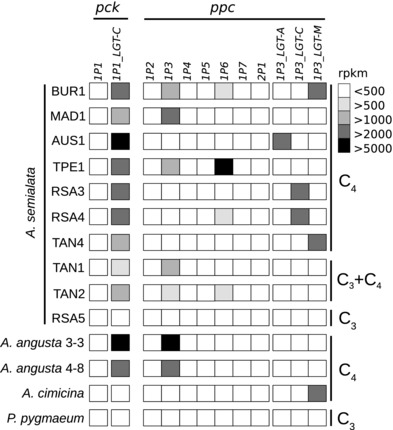
Leaf abundance of pck and ppc genes in the different accessions.
The shade indicates the relative expression (in rpkm) in the different accessions. For each accession, the averages are used. For raw values, see Table S4.
Official websites use .gov
A
.gov website belongs to an official
government organization in the United States.
Secure .gov websites use HTTPS
A lock (
) or https:// means you've safely
connected to the .gov website. Share sensitive
information only on official, secure websites.
Leaf abundance of pck and ppc genes in the different accessions.
The shade indicates the relative expression (in rpkm) in the different accessions. For each accession, the averages are used. For raw values, see Table S4.