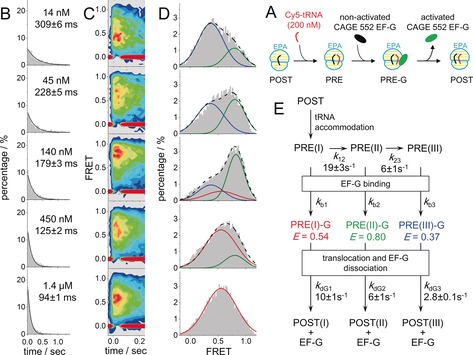
Figure 3.

A) An illustration of how to use sm‐PAFRET between A‐site tRNA and EF‐G to capture transient interactions between EF‐G and the ribosome. A mixture of Cy5–aa‐tRNA and CAGE‐552–EF‐G was supplied to immobilized POST complexes together so that EF‐G could catalyze translocation as soon as the PRE complex was formed, the lifetime of which would highly depend on EF‐G concentration. B, C, D) Dwell‐time distributions (B), time‐dependent FRET contour plots (C) constructed from trajectories aligned to the beginning of FRET events as t=0, and FRET distributions (D) of sm‐PAFRET between Cy5–aa‐tRNA and CAGE‐552–EF‐G under various concentrations of CAGE‐552–EF‐G. Increasing the EF‐G concentration shifts the major FRET population from a low‐FRET state (blue, E=0.37) to a high‐FRET state (green, E=0.80), and finally to a middle‐FRET state (red, E=0.54) as shown in (D). Total numbers of events were normalized to 100 % in (B) and (D). E) A proposed reaction scheme to reconcile EF‐G concentration‐dependent FRET dwell times and distributions. Assuming EF‐G binding rates are the same (150 μm −1 s−1) for all PRE complexes, transition rates between PRE complexes and dissociation rates of EF‐G from three transient intermediate complexes were estimated through global fitting from our sm‐PAFRET measurements and listed. SEM values are shown.
