Figure 2.

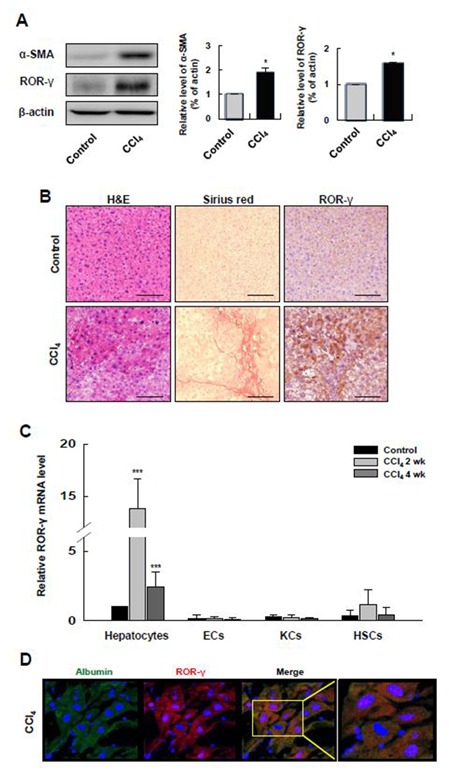
ROR‐γ is upregulated in the hepatocytes of a mouse model of liver fibrosis. (A) The protein levels of α‐SMA, ROR‐γ and β‐actin were determined in CCl4‐induced fibrotic liver tissues by Western blot. The relative expressions were normalized to β‐actin as a reference. The graph shows quantitative densitometry from the Western blot. (B) Histological analyses were performed on dissected fibrotic liver tissues after CCl4‐injection. The fibrotic liver tissues were stained with H&E, Sirius red, and antibodies against ROR‐γ. Original magnification: 100×. (C) ROR‐γ mRNA expression was evaluated by qRT‐PCR in different types of cells isolated from the liver of control and CCl4‐injected mice after 2 weeks or 4 weeks. (D) Double immunofluorescence staining for albumin (green) and ROR‐γ (red) performed in tissue samples control and CCl4‐injected mice. Nuclei were stained with DAPI (blue). Original magnification: 400×. Control: liver tissues of mock‐injected mice; CCl4 2 wk: liver tissues of CCl4‐injected mice 2 weeks after injection; and CCl4 4 wk: liver tissues from CCl4‐injected mice 4 weeks after injection. Values are presented as the mean ± standard error of the mean (n = 3). All data are representative of at least three independent experiments. *P < 0.05, **P < 0.01, ***P < 0.001.
