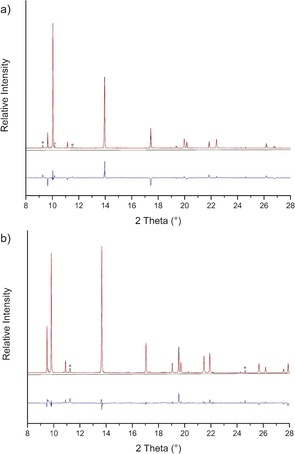
Figure 3.

Crystal‐structure refinements of NiAs‐type FeN based on full diffraction profiles at a) 13.3 GPa and b) 0.1 MPa. The observed pattern is shown in black, the calculated one in red, and the difference in blue. The marked reflections (*) are attributed to secondary phases (see text).
