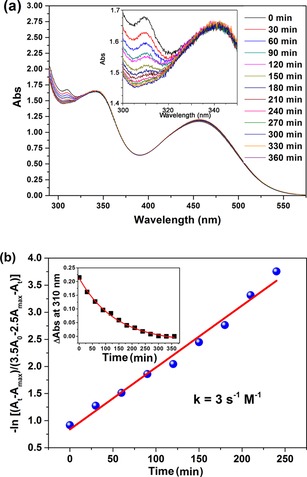
Figure 2.

a) Cu‐free click reaction between PB‐1 (40 μm) and Co‐N3 (100 μm) in dry acetonitrile solution monitored by UV/Vis absorption spectroscopy with respect to time; the inset is a magnification of the near‐UV region. b) The change in UV/Vis absorbance at 310 nm as a function of time during the reaction (points) and second order reaction kinetic fittings (lines); the inset shows the absorption vs. time whereas the main figure is a plot according to Equation (1).
