Figure 5.

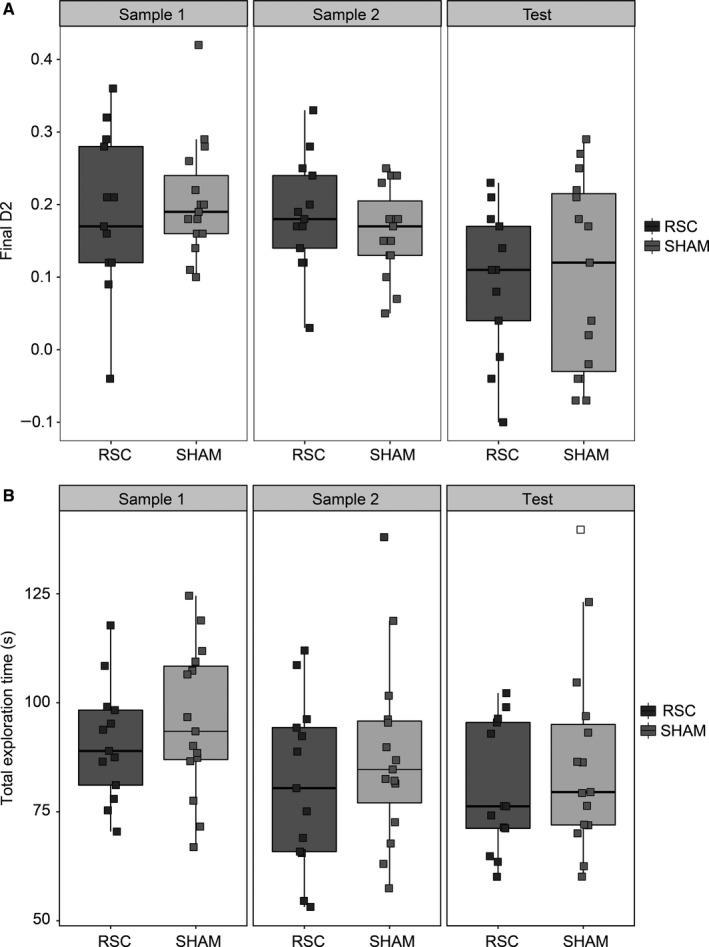
Experiment 1a, Between‐Block Recency. (A) The final D2 scores from Sample Phase 1 and 2 (recognition), as well as the Recency Test Phase in both groups. (B) Total exploration time during the two Sample Phases and the Test Phase in the retrosplenial cortex lesion (RSC) and Sham groups. The central line on each box shows the median value. The box extends from the first to the third quartile. The upper and lower whiskers extend 1.5× interquartile range. Note that data points were ‘jittered’ on the x‐axis, by adding random noise to the values of the categorical variable, in order to better visualise overlapping data points.
