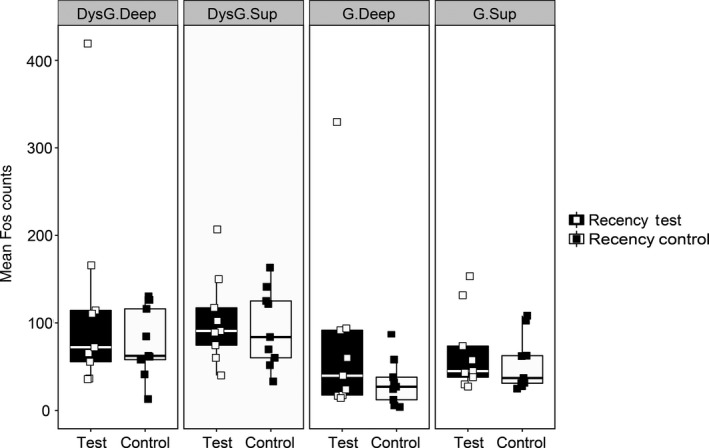
Figure 8.

Experiment 2, c‐fos expression associated with recency memory. Comparison of the Fos‐positive cell counts in each of the major retrosplenial subareas for the Recency Test and Recency Control groups. Error bars show ± SEM. Abbreviations: DysG.Deep: Dysgranular cortex, deep layers; DysG.Sup: Dysgranular cortex, superficial layers; G.Deep, Granular cortex, deep layers; G.Sup: Granular cortex, superficial layers. The central line on each box shows the median value. The box extends from the first to the third quartile. The upper and lower whiskers extend 1.5× interquartile range. Note that data points were ‘jittered’ on the x‐axis (see Fig. 5).
