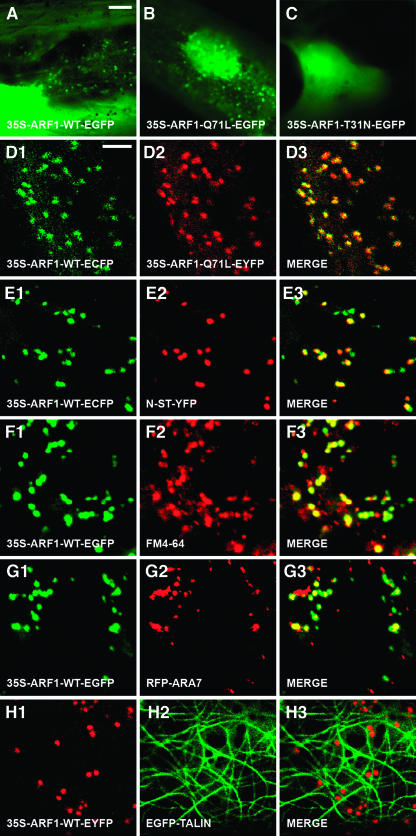
Figure 1.
Transient Expression and Intracellular Localization of Arabidopsis ARF1 and Its Dominant Mutants in Onion Epidermal Cells.
(A) to (C) Transient expression of 35S-ARF1-WT-EGFP (A), 35S-ARF1-Q71L-EGFP (B), and 35S-ARF1-T31N-EGFP (C).
(D1) to (D3) Colocalization analysis of 35S-ARF1-WT-ECFP ([D1]; green) and 35S-ARF1-Q71L-EYFP ([D2]; red). Merged image of (D1) and (D2) is depicted in (D3). Note that all ECFP fluorescence coincides with EYFP fluorescence.
(E1) to (E3) Colocalization analysis of 35S-ARF1-WT-ECFP ([E1]; green) and N-ST-YFP ([E2]; red). Merged image of (E1) and (E2) is depicted in (E3).
(F1) to (F3) Colocalization analysis of 35S-ARF1-WT-EGFP ([F1]; green) and FM4-64 ([F2]; red). Merged image of (F1) and (F2) is depicted in (F3).
(G1) to (G3) Colocalization analysis of 35S-ARF1-WT-ECFP ([G1]; green) and RFP-ARA7 ([G2]; red). Merged image of (G1) and (G2) is depicted in (G3).
(H1) to (H3) The fluorescence of 35S-ARF1-WT-EYFP ([H1]; red) is associated with the cortical network of actin filaments marked by EGFP-TALIN ([H2]; green). Merged image of (H1) and (H2) is depicted in (H3).
Bars = 25 μm in (A) for (A) to (C), 5 μm in (D) for all other panels.

