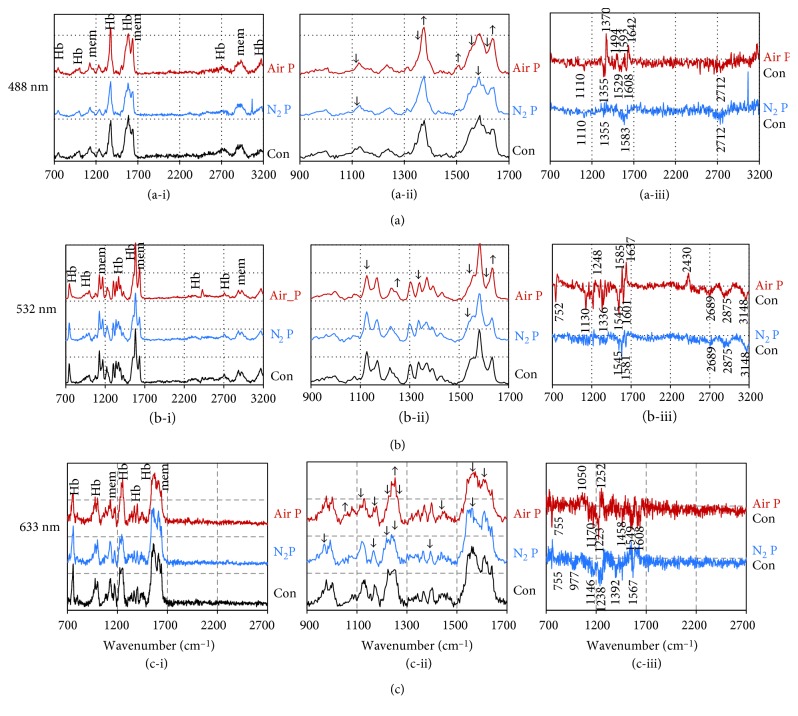
Figure 4.
Raman spectroscopy of RBCs after air and N2 APPJ treatment using excitation lasers with wavelengths of (a) 488 nm, (b) 532 nm, and (c) 633 nm. The Raman spectra of control RBCs, air APPJ-treated RBCs, and N2 APPJ-treated RBCs were displayed in the ranges of (i) 700–3200 cm−1 and (ii) 900–1700 cm−1 wave numbers, and (iii) the differences between APPJ-treated samples and control were separately displayed.

