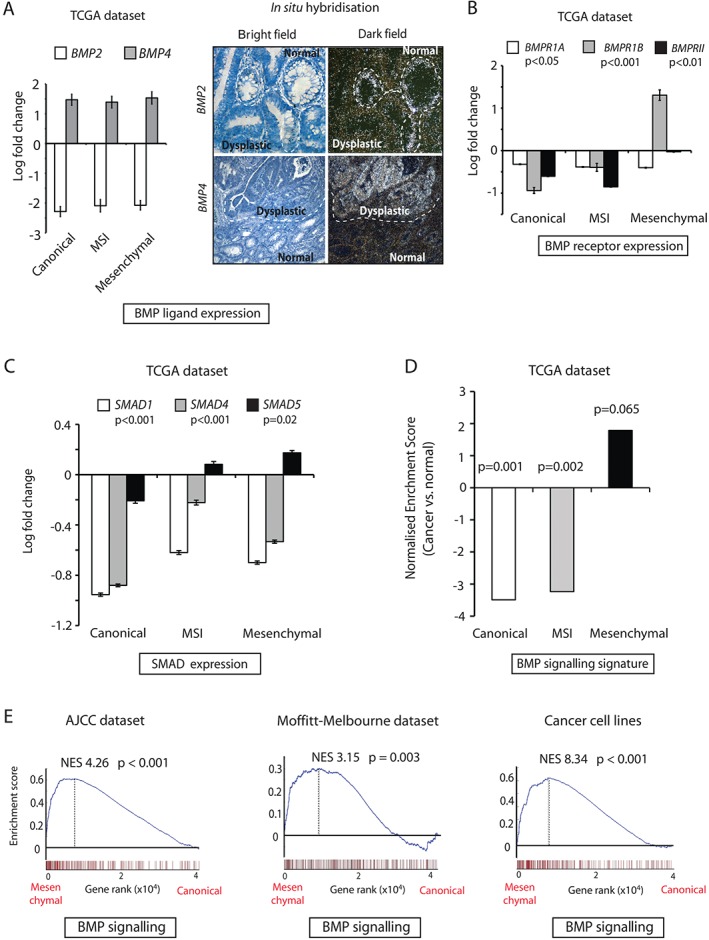
Figure 4.

Variable BMP signalling in different CRC molecular subtypes. (A) Left: relative BMP2 and BMP4 ligand expression in TCGA CRC samples as compared with normal colonic tissues. CRC patients were divided into those having canonical (n = 149), MSI (n = 110) and mesenchymal (n = 78) tumours. Values are represented as log2 fold change ± standard error of the mean (SEM). P‐values were calculated with anova. Right: representative images of BMP2 and BMP4 mRNA in situ hybridization showing downregulation or upregulation of ligands, respectively, in dysplastic versus normal human colonic tissue. (B) Relative BMPR1A, BMPR1B and BMPRII mRNA expression in CRC samples as compared with normal colonic tissues. Values represent log2 fold change ± SEM. P‐values were calculated with anova. (C) Relative SMAD1, SMAD4 and SMAD5 mRNA expression in CRC samples as compared with normal colonic tissues. Values represent log2 fold change ± SEM. P‐values were calculated with anova. (D) Normalized enrichment scores on TCGA CRC subtypes obtained by use of an HCEC‐generated BMP signature (281 genes) as an a priori gene set. P‐values were generated with Kolmogorov–Smirnov statistics. (E) Gene set enrichment plots created by the use of a BMP signalling signature (281 genes) on two independent CRC datasets and a panel of CRC cell lines, comparing mesenchymal with canonical subtypes. P‐values were generated with Kolmogorov–Smirnov statistics.
