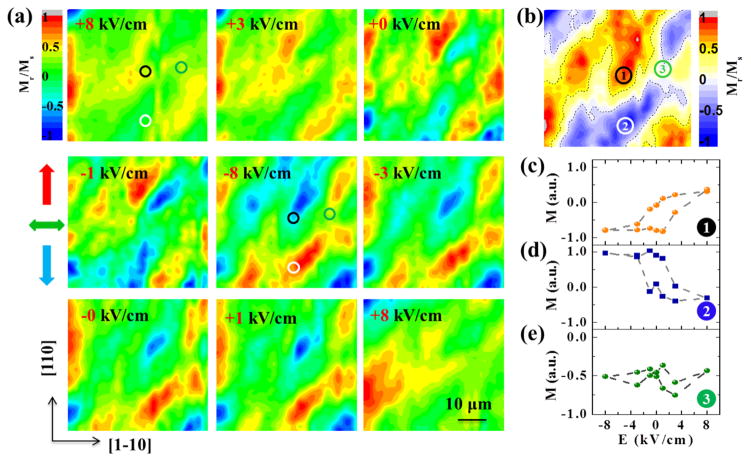
Figure 2.
Electric field control of magnetism with SKM. (a) Scanning MOKE maps of Mr/Ms in a 50 × 50 μm2 area under different static electric fields. The in-plane longitudinal MOKE was aligned to the [110] direction of PMN-PT substrates. The colored arrows at the left represent the different magnetic moment orientations. (b) The difference of SKM images under ±8 kVcm−1 (M+8–M–8) deduced from panel a. The dotted lines are a guide for the eye to distinguish three types of contrasts. (c–e) The local static electric-field-controlled magnetization (M–E) curves for the different regions numbered in panel b. The uncertainty in the measurement is smaller than the point size.

