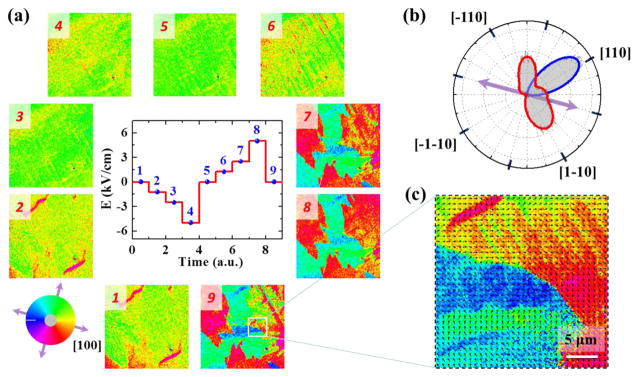
Figure 3.
Electric field control of magnetism with SEMPA. (a) Nine SEMPA images of the CoFeB magnetization under electric fields. The measurement sequence is shown in the central inset. The magnetic moment direction is defined by the color wheel and crystal directions as shown in the left inset. (b) The angular distribution of the magnetization in image 5 of panel a after negative poling is depicted by the blue curve. The angular distribution of the magnetization in image 9 after positive poling is depicted by the red curve. (c) A higher-resolution SEMPA image of a selected area of image 9 after positive electric field poling. The arrows along with the color wheel show the local magnetization direction.

