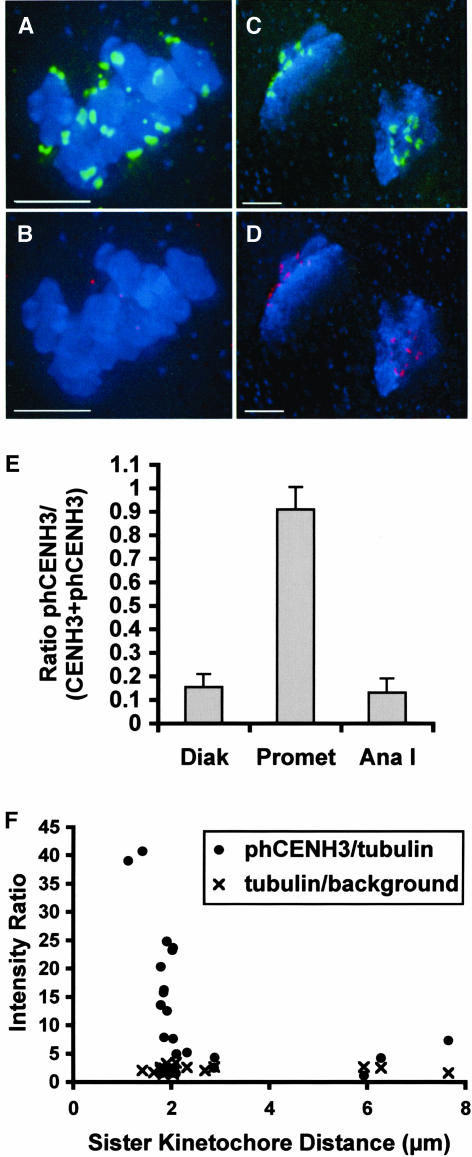
Figure 6.
Quantitative Analysis of phCENH3-Ser50 Staining at Various Stages of Meiosis.
(A) to (D) Partial projections from three-dimensional data sets, in which phCENH3-Ser50 is shown in green, CENH3 in red, and chromosomes in blue. Bars = 5 μm.
(A) and (B) Colabeling of phCENH3-Ser50 and CENH3 at prometaphase I. Nearly all of the staining is from anti-phCENH3-Ser50 antisera (A); only random background staining is visible in the CENH3 channel (B).
(C) and (D) Colabeling of phCENH3-Ser50 and CENH3 at anaphase I. phCENH3-Ser50 staining is relatively weak (C), scaled up here to make it visible, whereas CENH3 staining is bright (D).
(E) The ratio of phCENH3-Ser50 to CENH3 plus phCENH3-Ser50 staining at three stages of meiosis I. Staining data were averaged from three to five cells at each stage, all from the same slide.
(F) CENH3 is rapidly dephosphorylated at anaphase onset. Data are expressed as tubulin S/N ratios (×) or as phCENH3-Ser50 S/N divided by tubulin S/N (closed circles) plotted against the distance between sister kinetochores. Previous analysis of meiosis II in the W23 inbred (Yu et al., 1999) established that anaphase II commences when the kinetochores are roughly 1.8 to 2.1 μm apart.

