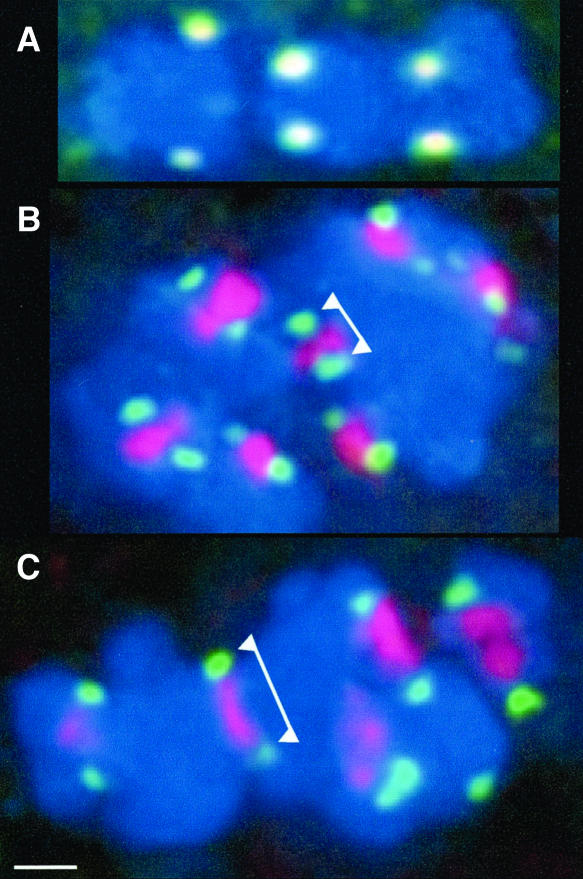
Figure 7.
Differential Localization of phH3-Ser28 and CENPC.
(A) Double labeling of CENPC (green) and phCENH3-Ser50 (red). The two signals overlap to produce a yellow color.
(B) Double labeling of CENPC (green) and phH3-Ser28 (red) at prometaphase (average kinetochore to kinetochore distance in this cell was 1.40 μm, n = 7). Note that the phH3-Ser28 lies between sister chromatids and does not overlap with the CENPC staining (arrowheads).
(C) Double labeling of CENPC (green, arrowheads) and phH3-Ser28 (red) at late metaphase (average kinetochore to kinetochore distance in this cell was 1.93 μm, n = 7). In this case, the phH3-Ser28 domain is stretched between the kinetochores as if it were under tension. Bar = 1 μm.

