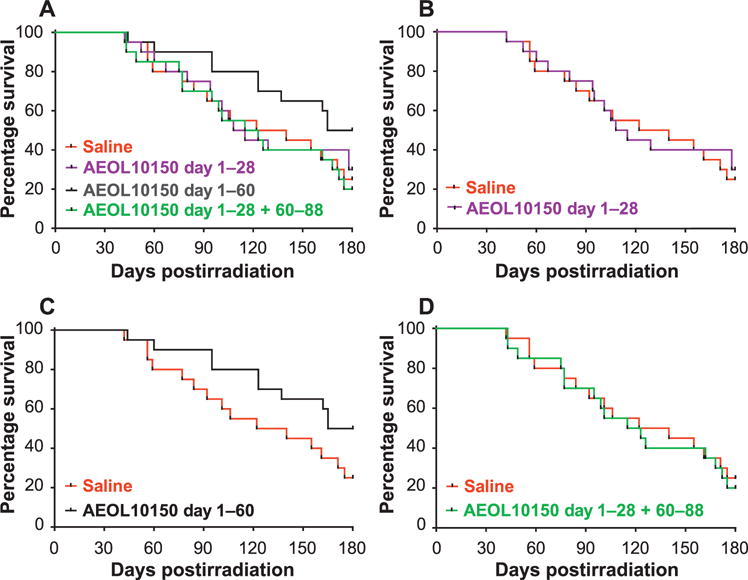
FIG. 1.

Kaplan-Meier survival curves demonstrating schedule-dependent outcome over time for all 10.74 Gy WTLI NHP cohorts. Survival over 180 days is plotted for the control (saline) and each AEOL 10150-treated cohort. Panel A: All cohorts; panel B: AEOL 10150 day 1–28 cohort. Panel C: AEOL 10150 day 1–60. Panel D: AEOL 10150 day 1–28 plus day 60–88 cohort. Comparison of the survival curves, using the one-sided, exact log-rank test, showed significant difference (P = 0.042) in the survival probability of the AEOL 10150 day 1–60 cohort relative to the control.
