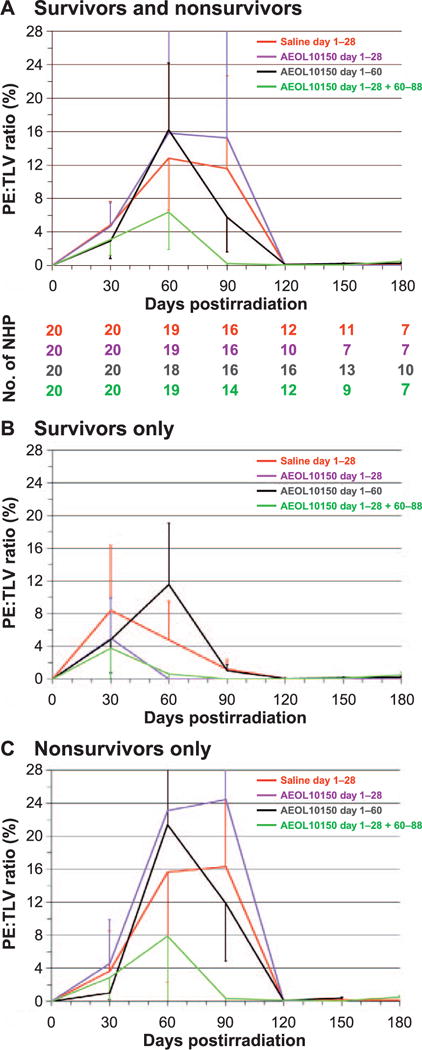
FIG. 7.

Radiographic (CT) analysis of lung injury over time, showing the mean ratio of volume of pleural effusion indexed against the total lung volume (PE:TLV) as percentage and as a function of treatment after WTLI with the control (saline) and the AEOL 10150-treated cohorts (day 1–28, day 1–60 and day 1–28 plus day 60–88). CT scans were performed at baseline and every 30 days after WTLI until the end of study at 180 days or until the animal met euthanasia criteria. Scan results beyond day 30 on the graph are influenced by medical management with dexamethasone and ongoing morbidity and mortality of animals with the greatest pulmonary injury. Error bars represent SEM. Panels A–C: Comparison of mean PE:TLV over time for all NHP survivors and nonsurvivors (panel A), survivors only (panel B) and nonsurvivors only (panel C) in the control cohort and each AEOL 10150-treated cohort. Panel A shows diminishing numbers of NHP for each time point from baseline to day 180 postirradiation.
