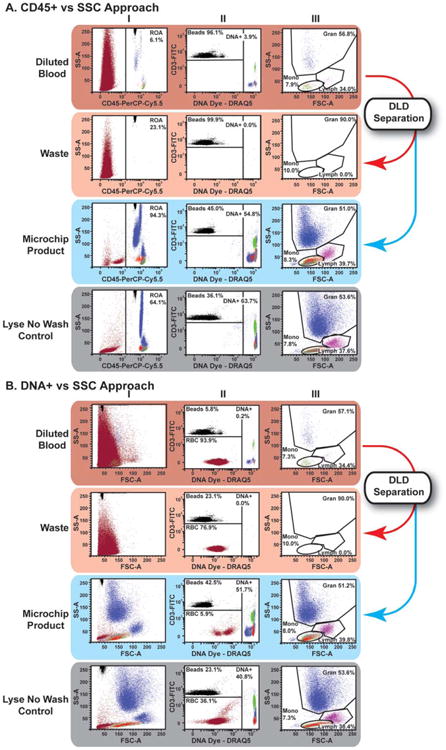
Figure 3.

DLD microchip processing of immunostained unlysed blood using optimized buffer and a buffer flush resulted in WBC preparations suitable for standard flow cytometric data analysis approaches. Flow cytometric data from Experiment 6 of Table 3: The top rows of Panels A and B are flow cytograms of immunostained unlysed, unprocessed blood after simple dilution (1:200). The middle two rows of Panels A and B are flow cytograms of the same blood sample after DLD microchip processing into Waste and Product samples. The bottom rows of Panels A and B are flow cytograms of the same blood sample after processing by the Lyse No Wash protocol. Samples were acquired after setting a threshold on FSC signals to include all counting beads. Then, data was analyzed by either the CD45/SSC approach (Panel A) or the DNA/SSC approach (Panel B), as described: A. CD45/SSC approach: To enrich signals from CD45+ WBCs, a gate was set to include all channels in SSC and all CD45+ signals (Column I), including counting beads that registered as fluorescent events. In the CD45+ region of analysis, counting beads discriminated from DNA positive events as shown. CD45+/DNA+ positive events were displayed and gated in forward vs. side scatter to discriminate primary leukocyte subsets suitable for further analysis (Column III). B. DNA/ SSC approach: Using a similar reagent cocktail as panel A, data was acquired with FSC for the purposes of demonstration (Column I), the use of a FITC vs. DNA dye fluorescence plot (Column II) was used to identify nucleated cells (DNA+), counting beads (FITC+/DNA−) and any remaining RBCs (FITC−/DNA−). The Nucleated cell (DNA+) were displayed and gated in forward vs. side scatter to discriminate primary leukocyte subsets suitable for further analysis, similar to the approach in Panel A (Column III).
