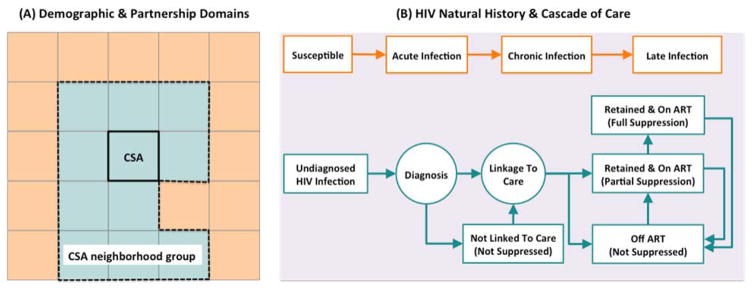
Figure 1. Overview of simulation modules.
This figure illustrates the schematic simulation logic for modeling the demographic and partnership networks among MSM (panel A), as well as HIV natural history and the cascade of care (panel B). Panel A: The population is structured into a collection of Community Statistical Areas (CSAs) and CSA neighborhood groups, which are in turn based on geographical proximity, and the level of similarity in income and racial structure (represented schematically by same colors). Partnership domains are determined via discrete choice within an individual’s own CSA of residence, a random neighboring CSA, or a non-neighbor CSA. Once the partnership domain is established, individuals follow a search mechanism based on a combination of race- and age-dependent mixing patterns to select their future partner from the pool of eligible people in that domain. Panel B: HIV infection is modeled as a gradual decline in CD4 count and via three main states in the absence of HIV treatment (acute/chronic/late infection). The cascade of care models the processes for screening infected individuals, linking to care, retaining in care and starting ART.

